Analysis of Best Climb Speed in High Drag C-130 Variants
Analysis of Best Climb Speed in High Drag C-130 Variants
Link to PDFThis page was generated with pandoc from the original LaTeX source. Some of the figures and links do not work in the html version. Refer to the PDF link to see the original formated document
Introduction
Every pilot has briefed their four engine climb speed for the C-130 in their departure brief from the TOLD card provided by their engineer. From that point, until the engineer updates the TOLD card, that is the standard climb speed on four engines that the pilot will fly to their cruising altitude, and for en-route altitude changes. Interestingly, this speed may not be the optimal speed to climb at after climbing several thousand feet, as four engine climb speed is based on pressure altitude. The Technical Order 1C-130H-1-1 provides charts for finding four engine climb speed, but it never defines what this speed is. The Federal Aviation Administration (FAA) defines two types of best climb speed: V_X is the best angle of climb speed, the speed at which the airplane gains the greatest altitude for a given distance of forward travel, and V_Y is the best rate of climb speed, the speed at which the airplane gains the most altitude for a given unit of time. The TO does have an obstacle clearance speed, but this is for a different flap configuration than the standard flaps up climb.
Pressure Altitude
Pressure Altitude is the first entry into the TO 1C-130H-1-1 and is defined as the height above the standard datum plane (29.92 Hg and 15 degrees Celsius) . The Standard Datum Plane is a theoretical level where the weight of the atmosphere is 29.92 Hg (1,013.2 mb) as measured by a barometer. The pressure altitude can be determined by either of two methods: 1. Setting the barometric scale of the altimeter to 29.92 and reading the indicated altitude. 2. Applying a correction factor to the indicated altitude according to the reported altimeter setting. For the combat aviator, this can be read directly off of the altimeter with 29.92 Hg set in the Kollsman window. This indication is not corrected for variations in standard temperature, and is discussed below.
Gross Weight
This is the total weight of the aircraft, including all fuel, oil, ammo, cargo, passengers, equipment, etc.. This weight has a direct effect on the maximum rate of climb due to the increase in Angle of Attack, thus lift, required to support that weight. As weight is reduced, either through the consumption of fuel or the expenditure of ammunition, the wings can generate more surplus lift to enable a greater climb for the same given conditions.
Temperature Deviation
Pressure Altitude is a theoretical altitude, in that it rarely, if ever, actually represents the actual density of the air the aircraft is flying in. Since pilots care about actual performance of the aircraft, a correction to pressure altitude must be made. Density Altitude is Pressure Altitude corrected for non-standard temperature, which is any deviation from the standard lapse rate of 3.5 ^oF or 2 ^oC per 1,000 feet of altitude. To calculate Temperature Deviation, find what the standard temperature should be at that altitude and find the difference from actual temperature. For example, the standard temperature at 2,000 feet is 11 ^oC (15-(2*2)).
Engine Efficiency
Turbine engines rarely produce 100% of their rated power due to friction and heat wear on the engine components over time. Because the engine is not producing optimal thrust, the amount of lift generated is reduced.
Variant Drag Coefficient
An increase in drag requires an increase in thrust to produce the same amount of lift. Therefore, as drag increases the available excess thrust used to produce lift in a climb is reduced.
Development of Mathematical Model
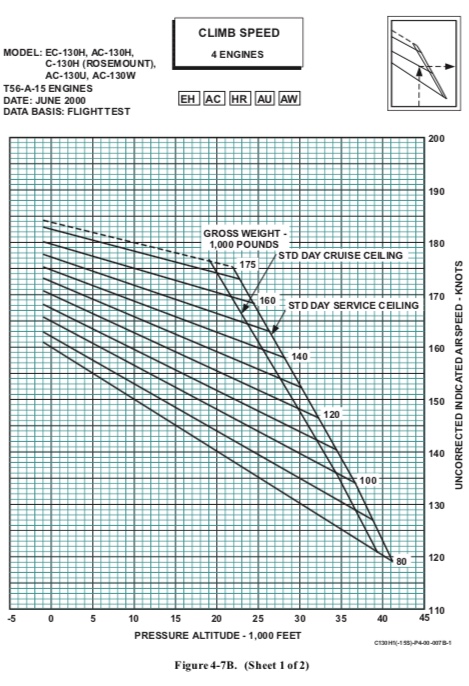
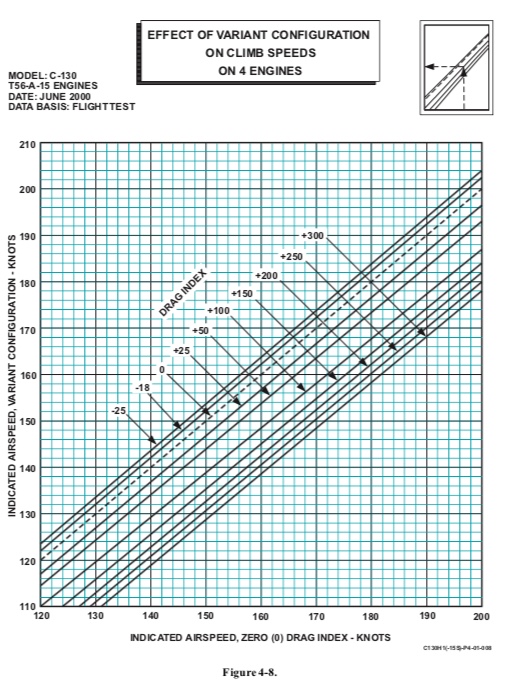
Below is a description of the equations used to model the four engine climb speed for a C-130 variant with a drag index of 200. Figure 1, Figure 2,and Figure 3 are from TO 1C-130H-1-1 Chapter 4.
Figure 1 accepts pressure altitude and aircraft gross weight and provides an uncorrected four engine climb speed to be input into Figure 2.

The slopes of the horizontal lines representing gross weight are listed in Table [uncorrected-climb]. The equations for the slopes of these lines can be linearly interpolated, with an resulting equations for Figure 1 as [eq:1]
| Gross Weight | Slope | Y Intercept |
|---|---|---|
| 175000 | -0.0004 | 184 |
| 160000 | -0.0005 | 179.55 |
| 140000 | -0.0006 | 177.75 |
| 120000 | -0.0007 | 170 |
| 100000 | -0.0008 | 165 |
\textup{Climb Speed Uncorrected} = 0.0000000052 \times \textup{GrossWeight} - 0.001329558 \times \\ \textup{PressureAlt} + 0.00025 \times \textup{GrossWeight} + 140.42169 -0.5 \label{eq:1}
Figure 2 compensates for temperature deviation, reduced Turbine Inlet Temperature Climb, engine efficiency, and low drag configurations. The only two corrections used on this chart for high drag C-130’s are Temp Dev and engine Efficiency.

The temperature deviation chart does not respond linearly, but the effect is not as pronounced as Figure 2 appears. Table [temp-dev] is the tabulated data from this section of the chart, and from this figure [temp-dev-graph] was created.
| -50 | -25 | 0 | +25 | +50 |
|---|---|---|---|---|
| 120.5 | 115.4 | 110 | - | - |
| 130 | 125.5 | 120 | 115.6 | 111.5 |
| 139.5 | 134.6 | 130 | 124.7 | 119 |
| 149.4 | 145 | 140 | 134 | 126.3 |
| 158.5 | 154.7 | 150 | 143 | 134.5 |
| 168.3 | 165.2 | 160 | 152.5 | 145 |
| 177.1 | 174.6 | 170 | 163.2 | 156.5 |
| 186.1 | 184.5 | 180 | 175.3 | 168 |
| 195 | 193.4 | 190 | 185.6 | 179.5 |
| - | - | 200 | 195.4 | 190.5 |
The colored lines each represent the transformation from input, uncorrected airspeed to temperature deviation corrected airspeed. These lines show that the deviation is least linear for the +25 ^oC and 50 ^oC lines, but they can still be approximated with linear equations with a minimal reduction of accuracy of plus or minus one knot.
Unfortunately, the coefficients of these linear equations do not vary linearly, but they do follow a quadratic pattern. The equation to interpolate between the various temperature deviations is presented in equation [eq:2].
\textup{Temp Dev Corrected Airspeed} =( 0.0000000009\times\textup{TempDev}^4 + 0.000000085\times\textup{TempDev}^3 - 0.0000151444\times\textup{TempDev}^2 + 0.0004865344\times\textup{TempDev}+ 1.0023015873) \times \textup{AirspeedIn} + (-0.0000058858\times\textup{TempDev}^3 + 0.0010638236\times\textup{TempDev}^2 - 0.2924101117*\times\textup{TempDev}- 0.1798236332) \label{eq:2}
Engine Efficiency is corrected with a simple linear equation presented in Equation [eq:3]. \textup{Airspeed Out}= 0.9995\times\textup{Airspeed In} - 1.82 \label{eq:3}
Figure 3 simply corrects for nonstandard drag variations. A variation of 200 was used for these examples and can be accounted for with the linear equation in Equation [eq:4]

\textup{Airspeed Out} = 1.0071\times\textup{Airspeed In} - 19.429 \label{eq:4}
The final equation used is the produced by chaining all of the previous equations together in Equation [eq:5].
\textup{Airspeed Out} = \\ 1.0071\times(0.9995\times( \\ 0.0000000009\times\textup{TempDev}^4 +\\ 0.000000085\times\textup{TempDev}^3 -\\ 0.0000151444\times\textup{TempDev}^2 +\\ 0.0004865344\times\textup{TempDev}+\\ 1.0023015873) \times (0.0000000052 \times\\ \textup{GrossWeight} - 0.001329558 \times \\ \textup{PressureAlt} + 0.00025 \times\\ \textup{GrossWeight} + 140.42169 -0.5) +\\ (-0.0000058858\times\textup{TempDev}^3 +\\ 0.0010638236\times\textup{TempDev}^2 -\\ 0.2924101117\times\textup{TempDev}-\\ 0.1798236332) - 1.82) - 19.429 \label{eq:5}
Four Engine Climb Speed Over Time
As the aircraft climbs, two things are happening: the aircraft is burning fuel, thus getting lighter, and the aircraft is passing through air that is becoming less dense. The effect of fuel burn is minimal, but present. It takes approximately 35 minutes on average for a heavy, high drag C-130 to reach it’s climb ceiling from sea level. In that time, the aircraft will burn 3,500 to 4,500 depending on atmospheric conditions and actual gross weight. The larger factor is the change in pressure altitude.
Figure [climb-speed-vs-alt] shows the decrease in climb speed for standard day + 10 ^oC at 140,000 pound aircraft as the aircraft increases pressure altitude. Figure [climb-speed-vs-alt] does not account for any loss of fuel.
Figure [climb-speed-vs-time] shows the effect of climb speed over time, assuming the aircraft’s maximum rate of climb is 700 feet per minute, starting at 0 feet pressure altitude, and burning 133 pounds of fuel a minute ( 8,000 pounds an hour) at maximum continuous TIT.
Finally, Figure [climb-speed-vs-pressure-real] shows a real world example of winds aloft data for Bagram Airfield (OAIX), Hurlburt Field, and Keflavik International at 0000Z on 18 July 2018 and the effect of actual temperature deviation on four engine climb speed. Temperature deviation is the second biggest contributor to variations in climb speed and cannot readily be applied by the pilot.
Conclusion
This paper has analyzed the contributing factors effecting four engine climb speed in high drag variants of the C-130. A mathematical model was built from charted flight tests to see the effect of changing these parameters over time, pressure altitude, gross weight, and temperature deviation from standard. From this model, a pilot can expect to see a one knot decrease in four engine climb speed for every 2,000 feet of pressure altitude, assuming a standard lapse rate for temperature decrease.